
Support is roughly split for hydraulic fracking, the process of extracting shale gas using chemically treated pressurized water. A recent United States poll shows 45% support, 41% don’t support, and the rest don’t know what it is. But of course that same poll shows fracking support is highly polarized, with Republicans supporting 71%/20% and Democrats against 22%/60%. Since environmental beliefs are tightly tied to identity politics in the US, it’s hard to change anyone’s mind. But one way to think about this is not to argue fracking is good. Obviously it’s not. Instead, start by acknowledging that energy generation is inherently dangerous. So let’s ask is how fracking compares to its clear alternative. Coal. And compared to fracking, coal is pure evil.
Let’s start by looking at the Environmental Kuznets Curve. From a recent paper:
In the first stage of industrialization, pollution in the environmental Kuznets curve world grows rapidly because people are more interested in jobs and income than clean air and water, communities are too poor to pay for abatement, and environmental regulation is correspondingly weak. The balance shifts as income rises. Leading industrial sectors become cleaner, people value the environment more highly, and regulatory institutions become more effective. Along the curve, pollution levels off in the middle-income range and then falls toward pre-industrial levels in wealthy societies.
While it’s disputed how well the Kuznets Curve applies to environmental degradation across the board, it’s generally accepted to work for air pollution. Empirically the intensity of air pollution peaks around $2000-$3000 annual income per capita. See the chart below (via economist Timothy Taylor) which tracks emissions intensity by country through time.
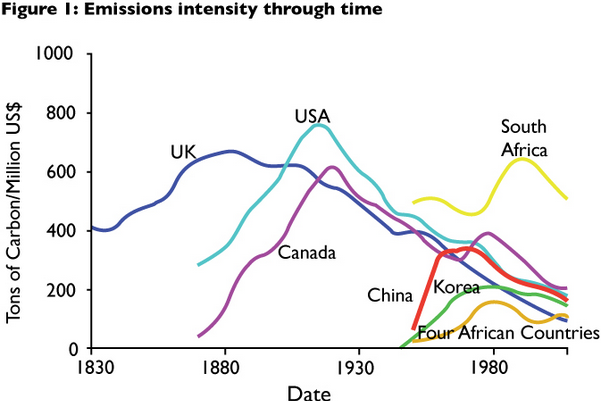
This chart is a little tricky because it tracks emissions intensity, which means emissions per unit income per person. Think of it this way: as we head towards the peak, each added $1 of income adds more air pollution than the $1 before it. Just past the peak, each $1 of income still adds pollution, but at a declining rate. Way past the peak, the amount of pollution per $1 income declines so fast that the net total air pollution starts to go down. At that point people are wealthy enough to push for clean air and are willing to pay the price. So London still had terrible smog way past the 1880 UK intensity peak, with a horrible occurrence in 1952 killing 4000 people. And air pollution in Los Angeles was at its worst in 1970. People who panic about China’s current struggles with air pollution seem to have forgotten all this recent history. China’s just late to the game. We should not be surprised when China skis down the backside of the Kuznets Curve to clean air. They just need another decade or two.
Next let’s look at the chart below from The Hamilton Project at the Brookings Institution (via Matthew Yglesias). Full study here. It’s a little hard to see, so click on it to view the full sized version. In blue is the private cost of electrical power generation, which is what it costs to build and run a plant. The costs to people and the environment are the social costs (externalities), which are split two ways. In purple are the non-carbon social costs, primarily the direct health impact to people. And in grey are the carbon social costs, which are the estimated greenhouse costs of carbon emissions. These are priced at the old US standard of $21/ton. Note the new standard is higher at $38/ton, which if used would bump the grey sections up by 60%.
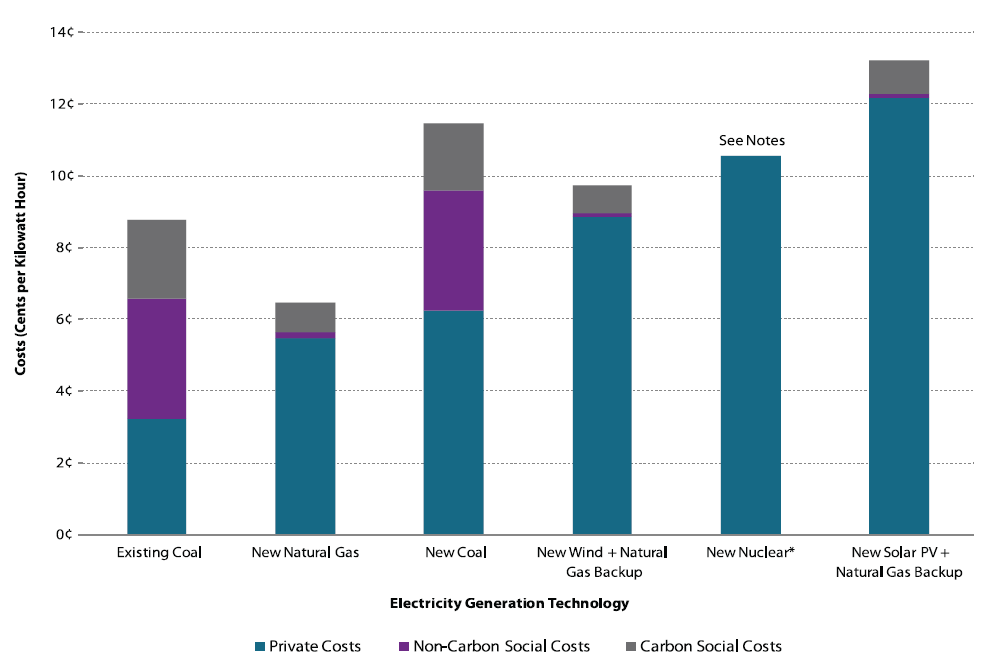
A couple of things to point out. If you exclude all social costs (bottom blue only), fracking has made it cheaper to build and run a new gas plant than a new coal plant. Next if you include the health impact costs (blue + purple), you can see that existing coal plants are actually worse than building new gas plants. This second stat is amazing, because it says we could shut down all existing coal plants and replace them with gas plants right now and come out ahead. This is true even without including carbon greenhouse gas effects (grey). In fact we worry so much about the grey, we forget the purple. The purple is lung disease, cancer, asthma, mining accidents. When I see coal, I see dead people. Lots and lots of dead people.
Let’s quantify this with a greatly underappreciated paper by Pushker A. Kharecha and James E. Hansen, titled “Prevented Mortality and Greenhouse Gas Emissions from Historical and Projected Nuclear Powwer“. This paper compares deaths per unit of electrical energy generated (Terawatt-hours) for coal, natural gas and nuclear. I’ve simplified their key Table 1 as below:

Coal kills 29 people per terawatt-hour of electricity generated. Natural gas kills 2.8 people. And Nuclear power kills .074 people. So coal is 10x worse than gas, and 390x worse than nuclear. The death estimates are “based on analysis for Europe (except as indicated) and represent the sum of accidental deaths and air pollution-related effects in Table 2 of ref 16. They reflect impacts from all stages of the fuel cycle, including fuel extraction, transport, transformation, waste disposal, and electricity transport.”
Obviously the point of this paper is argue for nuclear power, and of course (no shock full disclosure) I agree. Chernobyl, the worst nuclear disaster of all time, led to 43 deaths. So I think the French have this one right. But of course the long term impact of radiation released from the Chernobyl accident remains highly contested, with many arguing it’s in the thousands. Regardless, what the paper does is attempt to take Chernobyl into account and forward project 40 years from 2010-2050, and estimate how many deaths we’d prevent if we replaced coal electrical power with gas or nuclear:
For the projection period 2010−2050, we find that, in the all coal case (see the Methods section), an average of 4.39 million and 7.04 million deaths are prevented globally by nuclear power production for the low-end and high-end projections of IAEA, respectively. In the all gas case, an average of 420 000 and 680 000 deaths are prevented globally (see Figure 2b,c for full ranges).
Let’s use the conservative low end estimate of 420,000 lives saved by replacing coal with gas. Over 40 years that works out to 10,500 dead people per year. Or 201 dead people a day. Coal’s health impact is remarkably similar to radiation poisoning. It’s silent, deadly and untraceably causes cancer. Only it’s been around so long people don’t flip out. Imagine what would happen if we discovered coal continued to kill precisely the same number of people as it does today, but by being radioactive. We’re talking over 4x the number of direct dead people from Chernobyl. But that many deaths every single day. If coal killed by radiation we’d have a massive global panic.
Now some would argue fracking is just a hack workaround. It’s not a “real” solution. But remember how the Kuznets Curve works. If we get a couple of decades of progress with fracking, we slide that much farther down the curve. And get that much wealthier. This makes renewable alternatives more affordable later on. In technology adoption, timing is everything.
What happens if we jump to solar or wind prematurely? Germany tried this out with a $130 billion spend on solar subsidies. The result? From Bjorn Lomborg: Using solar, Germany is paying about $1,000 per ton of CO2 reduced. The current CO2 price in Europe is $8. Germany could have cut 131 times as much CO2 for the same price. Instead, the Germans are wasting more than 99 cents of every euro that they plow into solar panels.
Furthermore, from the Christian Science Monitor: Coal plants increased production by about 5% to 130.3 TWh in the first six months of 2013 as output from gas-fired power plants fell 17% to 21.9 TWh. That article opens with this line: In the very crowded field of unintended outcomes of EU energy policy, what is happening in Germany this year would be hilarious if it wasn’t so tragic.
Meanwhile in the US, from Bjorn Lomborg again: Carbon-dioxide emissions in the United States have dropped to their lowest level in 20 years. Estimating on the basis of data from the US Energy Information Agency (EIA) from the first five months of 2012, this year’s expected CO2 emissions have declined by more than 800 million tons, or 14%, from their peak in 2007. The cause is an unprecedented switch to natural gas, which emits 45% less carbon per energy unit.
Global warming brings out the crazy in people. But you can sidestep this crazy if you pick a common enemy. Why not coal? Fracking is terrible. But coal is so much worse.

Which is worse coal or cars? I read that 60% of CO2 is from cars. But you can’t really cut down on cars unless people want to wait at the bus stop.
For CO2 transportation is much worse than power generation
http://www.giss.nasa.gov/meetings/pollution2002/summaryd.html
For dead people it’s 200k a year for pollution versus 34k for car accidents. Within pollution dead people is roughly split cars versus power generation.
http://ens-newswire.com/2013/09/04/air-pollution-blamed-for-200000-early-u-s-deaths-each-year/
http://en.wikipedia.org/wiki/List_of_motor_vehicle_deaths_in_U.S._by_year
I didn’t mean dead bodies metric, I meant as in “Is Earth F**ked?” metric, but yeah that’ll work.
There’s a good number of dead bodies resulting from inappropriate overuse of cars — lack of exercise causes hundreds of thousands of early deaths per year in the US. You can see this reflected in the lower mortality rates for people in cities where walking is more common, and in the reduced mortality rates for bicycle commuters (corrected for demographics and risk factors, of course).
Dealing with that alone won’t reduce fuel use that much — converting 10-20% of driving to more active forms of transit yields plenty go exercise — but it’s another set of deaths in the car column.
“Fracking is terrible. But coal is so much worse.” Did you know that your source for the latter statement contradicts the former? Yes, in Michael Greenstone and Adam Looney’s paper, their social cost of fracking is nearly zero. They know about soot studies, which disappears in a year, but not anything terrible about fracking, which has long term effects. This is a huge systematic error in that plot. Let’s consider that missing term, if only for just a minute. There’s evidence you probably won’t know about (for a reason discussed elsewhere) that fracking makes the water coming from that fracked area unsafe to drink for 1,000 years. Yes, they say they go below the water table. What that means, really, is that the water they inject isn’t stable down there. It’s density is just too low, so it slowly comes back up. That’s why water is in the ocean instead of the core, which has iron, mostly. Cost in the short term is low. People who leased their land (against their will) just have to pay $2/day per person for bottled water and have the compensation cash. But in 1000 years, the population goes up. So does the cost of fresh water, but more so; a fixed or decreasing supply implies a low elasticity and a large price increase. Say $20/day/person in present dollars. So, let’s just guess, a good fraction of the population, say 20 billion 500 years from now, have to buy bottled water. That’s $400 billion. Per day. For another 500 years. Total cost? $73,000 trillion. All so we can get slightly cheaper electricity for about 20 years. That’s the systematic error your post based on this and other bogus reports full of lesser errors I won’t bore you with ignores, IMPHO.
I agree with Jason in one sense : Natural gas and nuclear power have waste products: Contaminated water and nuclear waste. So far, there has not been a safe way to deal with those waste products. When we bury them in the Earth, they eventually leak and contaminate the local community. I guess your point is that those costs are minor vs. the benefits, and that the costs get blown out of proportion. I don’t agree since the costs (as Jason mentioned) seem long-term rather than short-term for the area where the waste products are.
You use a chart that puts $21/ton on greenhouse emissions, but I think the cost is far greater if we are considering the fate of the whole Earth. The real number is more like infinity for making the Earth difficult to live on (if you want to put a numeric dollar amount). In that case, clean energy like solar and wind is completely worth the up-front cost.
Solar power may be a “massive money pit” as the article you linked to, Lomborg on Germany , points out, but I think that pit reflects the true cost of energy. We are getting it too cheap and easy now. If we had a global agreement to go in that direction (which probably won’t happen until we see effects of global warming), we might even have a chance of living safely on the Earth in 100 years.
Dear Abe,
Upon reading your first sentence, I was happy to learn that you agree with only one thing in my comment, since it suggests you disagreed most of what I wrote, and I love learning the truth. There were 21 sentences in my comment, so I’m apparently wrong as much as 20/21=95% of what I wrote! I was eager to discover exactly what I was wrong about and why, but, unfortunately, you didn’t reveal either. I’m very accustomed to being accused of things behind my back, without any venue of even a muted rendition of justice to respond, but perhaps here I might at least beg of you to share what I’m wrong about, so that I might improve, learn, and correct my errors in a subsequent comment? Many thanks in advance if you can find the time to do so.
VR,
Jason